Table of Contents
The best AI network monitoring tool for most teams is Auvik for MSPs and distributed networks, LogicMonitor or Kentik for enterprise scale, PRTG for flexible sensor-based monitoring, and Zabbix when you can self-host for free. These tools watch your network devices, links, and traffic, detecting outages, congestion, and anomalies before users notice, and increasingly using AI to spot problems and pinpoint their cause automatically.
The trap that makes shopping painful: the billing unit is a minefield, and identical networks quote wildly differently depending on how each vendor counts. Auvik bills per device, PRTG per sensor, LogicMonitor by hybrid units, and Kentik by traffic flow. A network with few devices but many monitored metrics is cheap on one model and expensive on another. Without normalizing every quote to your actual environment, you cannot tell which tool is genuinely cheaper.
Every price below is a recent observed figure. Because enterprise platforms quote by scale and the units differ, treat each as a band and map your network to each model.
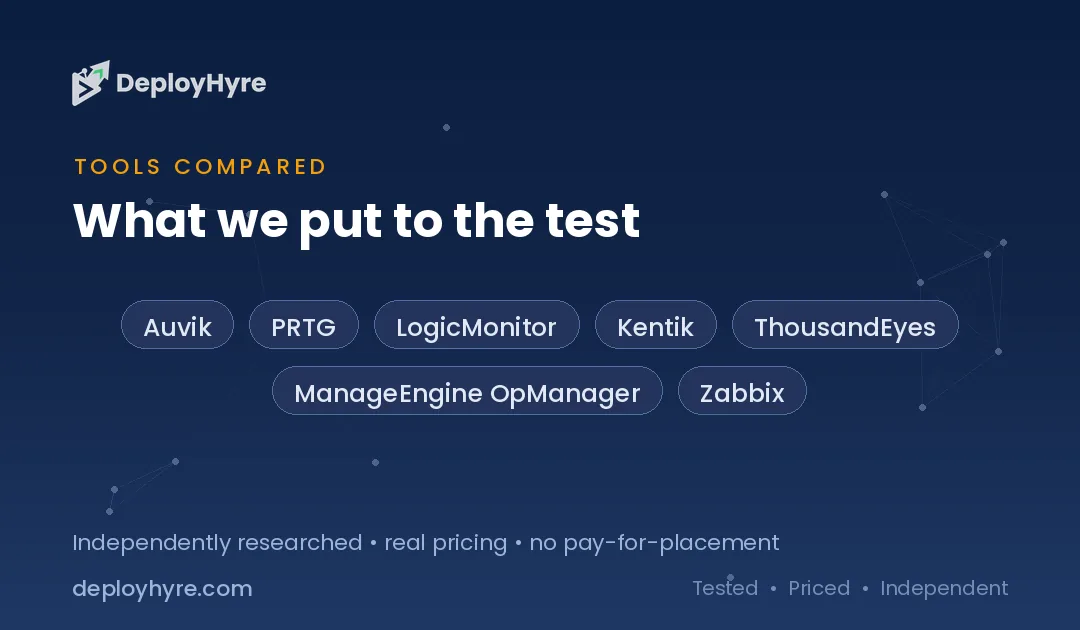
Quick Comparison: Network Monitoring Tools at a Glance
| Tool | Best For | Observed Price | Billing Unit |
|---|---|---|---|
| Auvik | MSPs, distributed networks | Quote (per device) | Per device |
| PRTG | Flexible sensor monitoring | Free to ~$1,492/mo (10K sensors) | Per sensor |
| LogicMonitor | Enterprise hybrid infrastructure | $16–$53/unit/mo | Hybrid units |
| Kentik | Traffic and flow analytics | Enterprise quote | Flow-based |
| ThousandEyes | Internet and WAN visibility | Enterprise quote | Per agent/unit |
| ManageEngine OpManager | Affordable per-device | Low per-device tiers | Per device |
| Zabbix | Open-source, self-hosted | Free (open source) | Self-managed |
What AI Network Monitoring Tools Do
Network monitoring tools continuously check the health of your network, routers, switches, firewalls, servers, links, and the traffic flowing across them. They poll devices for status and performance, map your topology, alert when something goes down or degrades, and help you diagnose where a slowdown originates. For any organization whose operations depend on the network, and that is nearly all of them, this visibility is what turns a mystery outage into a fixable problem.
The AI layer targets the two hardest parts of network operations: noise and root cause. AI establishes a baseline of normal behavior for each device and link, then flags anomalies without you setting static thresholds, and it correlates a cascade of alerts into a single probable cause so you fix the source rather than chasing symptoms. This is increasingly essential as networks span on-premises, cloud, and SD-WAN, where manual correlation across environments is impractical.
Network monitoring overlaps with broader observability and security. It complements the application-layer view in our best AI observability tools guide and feeds network telemetry into the detection stack in our best AI SIEM tools guide.
The Billing Unit Is a Minefield
Network monitoring tools count in incompatible units, so the same network produces very different quotes and you must normalize each to your environment to compare fairly. Auvik and OpManager bill per device, so cost scales with device count. PRTG bills per sensor, a sensor being one monitored aspect (a port, a metric), so a few devices with many monitored metrics add up. LogicMonitor uses hybrid units at $16 to $53 each. Kentik bills by traffic flow. Each model favors a different network shape.
The practical example: PRTG runs from free up to about $1,492 a month for 10,000 sensors, which sounds cheap until you realize a single switch can consume dozens of sensors. Per-device tools look expensive per unit but predictable if your device count is stable. Flow-based Kentik scales with traffic, not hardware. Count your devices, your monitored metrics per device, and your traffic volume, then price each tool on its own unit, because the cheapest headline rate rarely wins once mapped to your real network.
Best for MSPs and Distributed Networks
Auvik is the standout for managed service providers and organizations with distributed or multi-site networks, combining automated network mapping, per-device monitoring, and multi-tenant management in one cloud platform, priced per device on a quote. Its automatic topology discovery is the differentiator: it maps a network it has never seen and keeps the map current, which is exactly what MSPs managing many client networks and IT teams with sprawling sites need. The per-device model is predictable when your device count is known, and the multi-tenant design fits providers managing many networks at once.
ManageEngine OpManager is the value alternative in the per-device category, delivering solid network and server monitoring at lower per-device tiers, favored by budget-conscious IT teams that want capable monitoring without enterprise pricing. Both bill per device, so they suit organizations with a countable, relatively stable device inventory, Auvik leading on automated mapping and multi-tenancy, OpManager on affordability. For the servers these tools watch alongside the network, see our best cloud hosting guide.
Best Enterprise and Flow-Based Platforms
Kentik is the enterprise leader for network traffic and flow analytics, ingesting flow data to give deep visibility into what is actually traversing your network, priced on a flow-based enterprise quote. It excels where understanding traffic patterns, capacity, DDoS activity, peering, cloud egress, matters more than simple device up/down status, which is why large network operators and cloud-heavy enterprises adopt it. Its flow-based billing scales with traffic rather than hardware, so it fits organizations whose challenge is traffic complexity, not device count.
LogicMonitor is the broad enterprise choice for hybrid infrastructure, monitoring network, servers, cloud, and applications together at $16 to $53 per hybrid unit a month, with AIOps built in. ThousandEyes (Cisco) specializes in internet and WAN visibility, monitoring the paths between your users and the services they reach, which is invaluable for diagnosing problems in networks you do not own. All three are enterprise-grade; Kentik for flow analytics, LogicMonitor for hybrid breadth, ThousandEyes for internet-path visibility. For the AIOps correlation these platforms use, see our best AIOps tools guide.
Best Value and Open-Source Options
Zabbix is the leading free, open-source network monitoring platform, delivering enterprise-grade monitoring, alerting, and visualization at no licensing cost for teams with the capacity to run it. It monitors networks, servers, and applications comprehensively, and for organizations with the engineering resources to deploy and maintain it, Zabbix eliminates the per-device or per-sensor bill entirely. It is the standout when budget is the primary constraint and self-hosting is acceptable, trading licensing cost for operational effort.
PRTG rounds out the value tier for teams that want a flexible, sensor-based commercial tool with a genuinely free entry point (up to 100 sensors free) scaling to about $1,492 a month for 10,000 sensors. Its per-sensor model lets you pay precisely for what you monitor, which suits smaller networks or teams that want granular control over cost. Both are the pragmatic choices when enterprise platforms are more than you need, Zabbix for free self-hosting, PRTG for flexible commercial sensor-based monitoring.
How Should You Choose a Network Monitoring Tool?
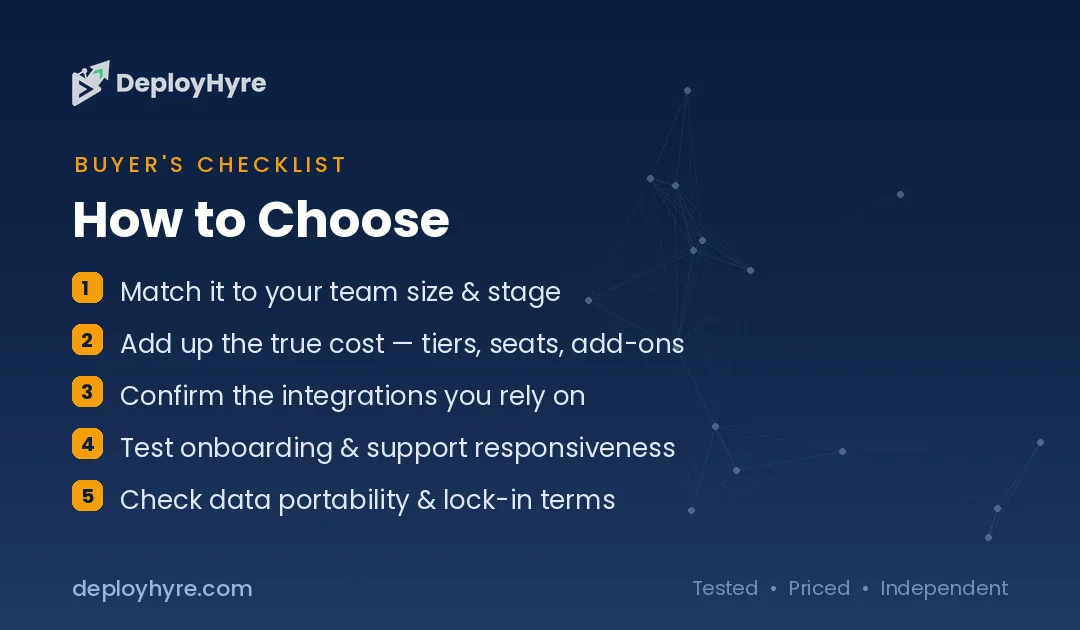
Map your network to each billing unit first, because that is where the real cost hides. Count your devices, the metrics you monitor per device, and your traffic volume, then price per-device (Auvik, OpManager), per-sensor (PRTG), hybrid-unit (LogicMonitor), and flow-based (Kentik) against those numbers. The cheapest headline rate rarely stays cheapest once mapped to your environment.
Then match the tool to your priority. MSPs and multi-site networks point to Auvik’s mapping and multi-tenancy. Traffic and flow analysis points to Kentik. Hybrid infrastructure breadth points to LogicMonitor. Internet and WAN path visibility points to ThousandEyes. Budget or self-hosting points to Zabbix or PRTG’s free tier.
Finally, weigh operational capacity. Open-source Zabbix eliminates licensing but requires you to run it; managed platforms cost more but free your team. And check the AI and AIOps features, anomaly detection and root-cause correlation, since those increasingly separate a tool that surfaces the real problem from one that just floods you with alerts.
How We Evaluated These Platforms
We evaluated each tool on monitoring coverage (devices, traffic, cloud), automated mapping, AI-driven anomaly detection and root-cause analysis, multi-tenancy for MSPs, and pricing model. Figures come from vendor pages and comparison sources. Because tools bill in incompatible units, we present observed rates for each and stress normalizing quotes to your own network. We accepted no payment for placement; rankings reflect fit for a stated use case.
The Bottom Line
Auvik leads for MSPs and distributed networks on automated mapping, Kentik for enterprise traffic analytics, LogicMonitor for hybrid breadth, and ThousandEyes for internet-path visibility. Zabbix is the free open-source champion and PRTG the flexible sensor-based value pick. Because the billing units are incompatible, map your devices, sensors, and traffic to each model before comparing, since the cheapest headline rate rarely wins once applied to your real network.
Frequently Asked Questions
How much do network monitoring tools cost?
It depends heavily on the billing unit. PRTG runs from free (100 sensors) to about $1,492 a month for 10,000 sensors, LogicMonitor is $16 to $53 per hybrid unit a month, and Auvik and Kentik are quote-based (per device and per flow respectively). Enterprise platforms can run from tens of thousands to hundreds of thousands a year, while Zabbix is free open source.
What is the difference between per-device and per-sensor pricing?
Per-device pricing (Auvik, OpManager) charges for each network device you monitor, so cost scales with device count. Per-sensor pricing (PRTG) charges for each monitored aspect, a port or metric, so a single device with many monitored metrics consumes many sensors. The same network can be cheaper on one model than the other, so map your environment to each.
What is the best free network monitoring tool?
Zabbix is the leading free, open-source option, offering enterprise-grade monitoring, alerting, and visualization at no licensing cost for teams that can self-host it. PRTG also has a genuinely free tier for up to 100 sensors, which suits small networks wanting a commercial tool without paying.
What does AI add to network monitoring?
AI baselines normal behavior for each device and link, then flags anomalies without manual thresholds, and it correlates a cascade of related alerts into a single probable root cause. This cuts alert noise and speeds diagnosis, which matters increasingly as networks span on-premises, cloud, and SD-WAN where manual correlation is impractical.
Which network monitoring tool is best for an MSP?
Auvik is widely favored by MSPs because it automatically maps client networks, monitors them per device, and supports multi-tenant management of many networks from one console. Its automated topology discovery is especially valuable for providers who must quickly understand and monitor networks they did not build.
Related Articles

David Austin is a technology writer and software analyst at DeployHyre, where he covers AI tools, SaaS platforms, cloud hosting, and business automation. He focuses on hands-on comparisons of pricing, features, and real-world performance so teams can pick the right software with confidence.